US Debt Analysis & Forecasting
OBJECTIVE: Analyze the historical trend and projected growth of U.S. public debt using daily records from 1993 to 2023. This project focuses on debt held by the public and intragovernmental holdings, examining growth rates, monthly patterns, and long-term projections through Excel-based calculations and visualizations.
BACKGROUND: U.S. national debt is one of the most closely watched indicators of fiscal health. As borrowing increases, understanding how debt levels evolve over time helps contextualize policy debates and economic conditions. This analysis addresses the following:
What is the annual growth rate of U.S. public debt?
Which months historically see the largest or smallest increases?
What are the long-term trends in debt composition?
How is publicly held debt projected to grow in the coming years?
TECH STACK:
Microsoft Excel: End-to-end data analysis and visualization
Pivot Tables: Aggregated historical trends by year and month
Built-in Excel Functions:
FORECAST,YEAR,AVERAGE,IFERROR, and percentage change formulasLine & Bar Charts: Visualized debt growth, monthly trends, and projections
Cell Formulas: Embedded directly into sheets for automated calculations in:
Year-over-year growth
Monthly averaging
Forecasting public debt growth
PROCESS:
Data Cleaning:
◇ Transformed wide-format data with dates as columns into long-form structured records
◇ Standardized number formatting to trillions for readability
◇ Removed missing or zero-value rows to ensure accurate resultsTrend Analysis & Visualization:
◇ Created line charts showing debt trends from 1993 to 2023
◇ Built bar charts to highlight average monthly increases in total debt
◇ Calculated annual percentage changes in:Debt held by the public
Intragovernmental Holdings
Total Public Debt Outstanding
Forecasting:
◇ Focused projections on "Debt Held by the Public"
◇ Used Excel’sFORECASTfunction to extend the trend through 2028
◇ Applied historical high values to contextualize projections
KEY INSIGHTS:
Annual Growth: From 2016 to 2019, the Total Public Debt Outstanding increased at an average rate of approximately 5% per year
Monthly Patterns: Historically, the largest increases in debt occur in January, February, November, and December
Trendline: An upward trajectory is evident in projected publicly held debt
Projection: Public debt is expected to continue growing, driven by long-term borrowing trends
CHALLENGES & SOLUTIONS:
⚠️ Challenge 1: The raw data had dates as column headers (wide format)
✅ Solution: Restructured the dataset using formulas to convert it into long format
⚠️ Challenge 2: Debt values were inconsistently formatted and included placeholders
✅ Solution: Cleaned and standardized values using formatting rules and filters
⚠️ Challenge 3: Forecasting within Excel had limitations in flexibility
✅ Solution: Used historical values alongside the FORECAST function to estimate reasonable future trends
⚠️ Challenge 4: The dataset begins in April 1993, but early years are incomplete, preventing consistent year-over-year calculations
✅ Solution: Focused analysis and charting on years with full records (e.g., starting from 1997) to ensure reliable comparisons
DATA SOURCES:
Dataset: US_Debt_Analysis_&_Forecasting.xlsx
Source: The dataset was sourced from fiscaldata.treasury.gov, specifically the U.S. Treasury’s “Debt to the Penny” historical records
Timeframe: April 1993 – February 2023
DATA DICTIONARY:
Debt Held by the Public: U.S. debt owned by external parties, including individuals, corporations, and foreign governments
Intragovernmental Holdings: Internal debt owed by the federal government to its own agencies (e.g., Social Security)
Total Public Debt Outstanding: Combined total of both categories above
VISUAL WALKTHROUGH: Each visualization below corresponds to the key questions above, now brought to life through data storytelling.
Click on any image to enlarge it to full screen.

Summary:
From 2016 to 2019, the Total Public Debt Outstanding increased at an average rate of approximately 5% per year. In 2020, there was a significant spike, likely driven by the U.S. government's pandemic response measures.

Summary:
Historically, the largest increases in debt occur in January, February, November, and December. In contrast, the lowest increases typically happen in April, May, June, and July.
Hypothesis:
During months with high debt increases, major U.S. holidays such as Thanksgiving, Christmas, and New Year’s lead to increased consumer spending, particularly on gifts. As a result, people may take on more debt during these months.
Conversely, during months with lower debt increases, the absence of major holidays reduces consumer spending, leading to less borrowing.
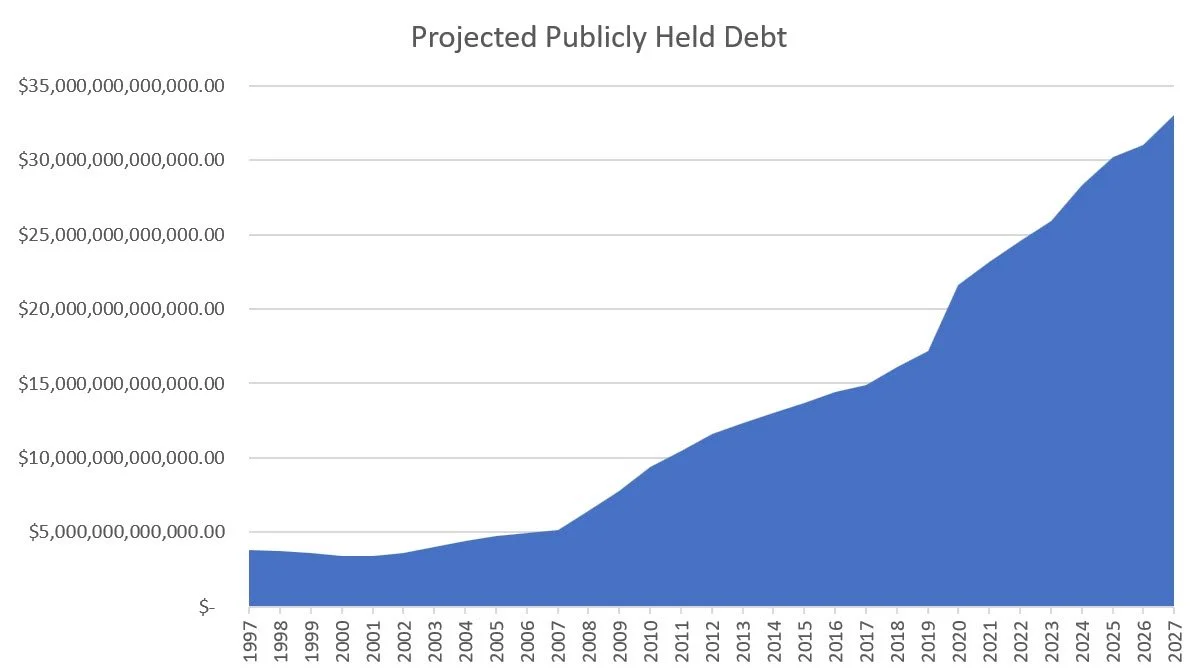
Summary:
From 1997 to 2007, publicly held debt increased by approximately $1 trillion.
From 2008 to 2019, debt rose from $6 trillion to $17 trillion.
From 2020 to 2022, debt increased from $21.5 trillion to $25 trillion.
From 2023 to 2027, publicly held debt is projected to reach $33 trillion.
Conclusion:
Publicly held debt is projected to continue rising significantly over the next five years.
Potential factors influencing debt growth include trends in the stock market, housing market, credit card debt levels, and unemployment rates.